GBP/USD Price Analysis: Bears seek a break of structure while price slows below 1.2200
- GBP/USD bulls could be tiring at this juncture.
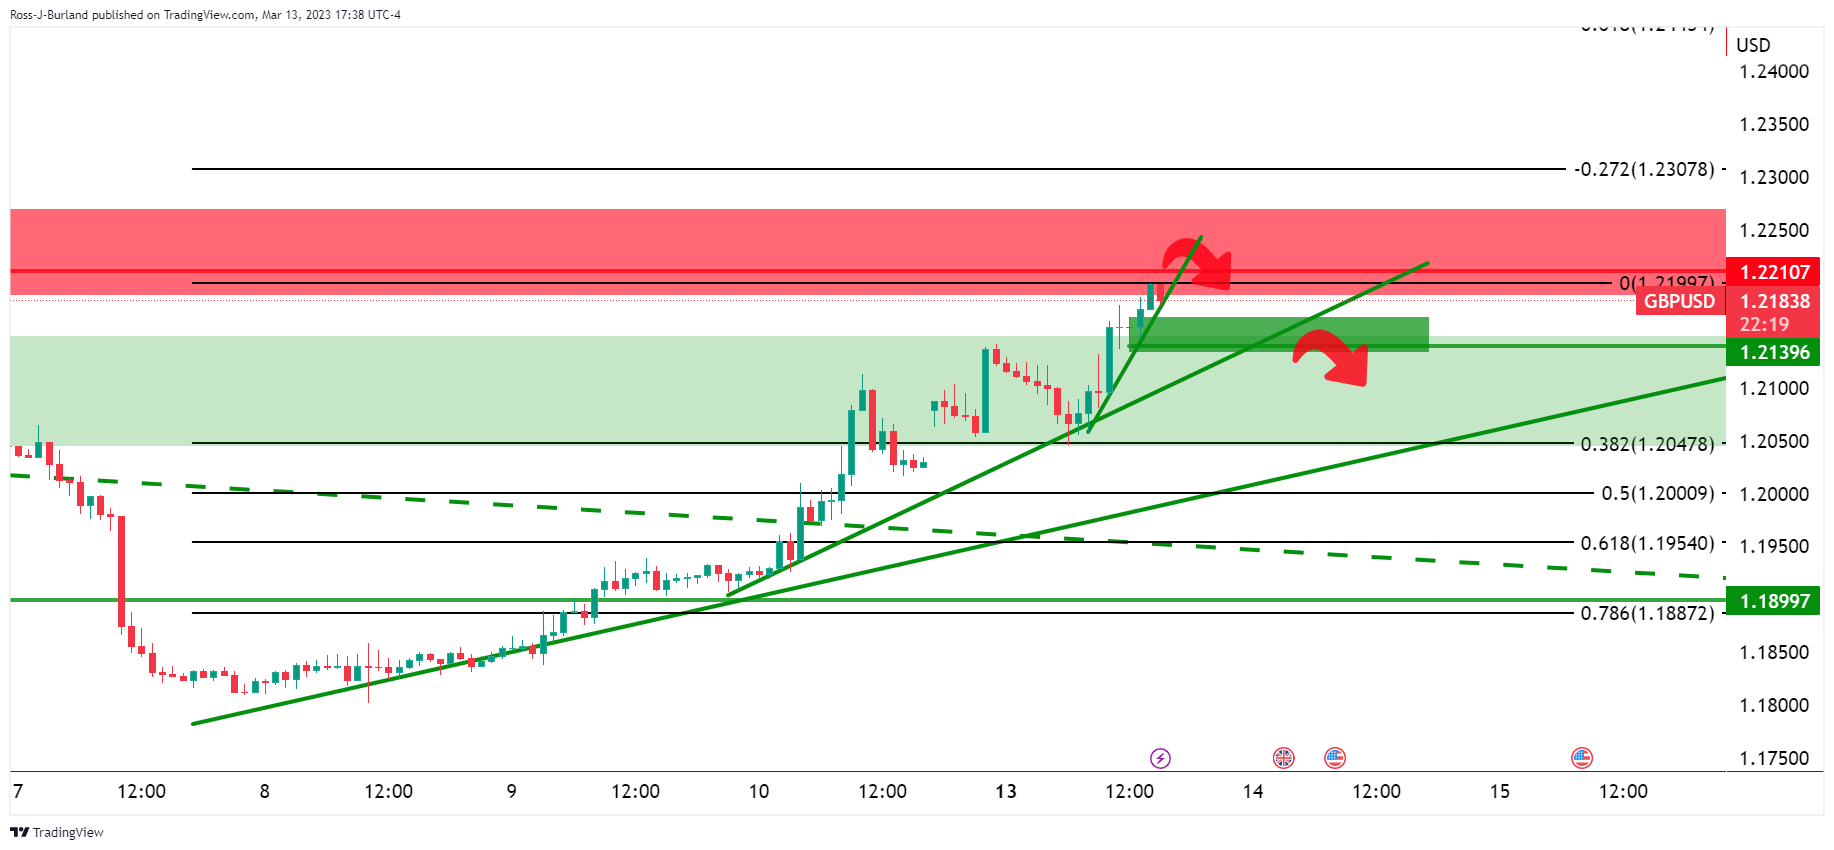
- Bears need to break the 1.2140 structure to cement the bearish case for the day ahead.
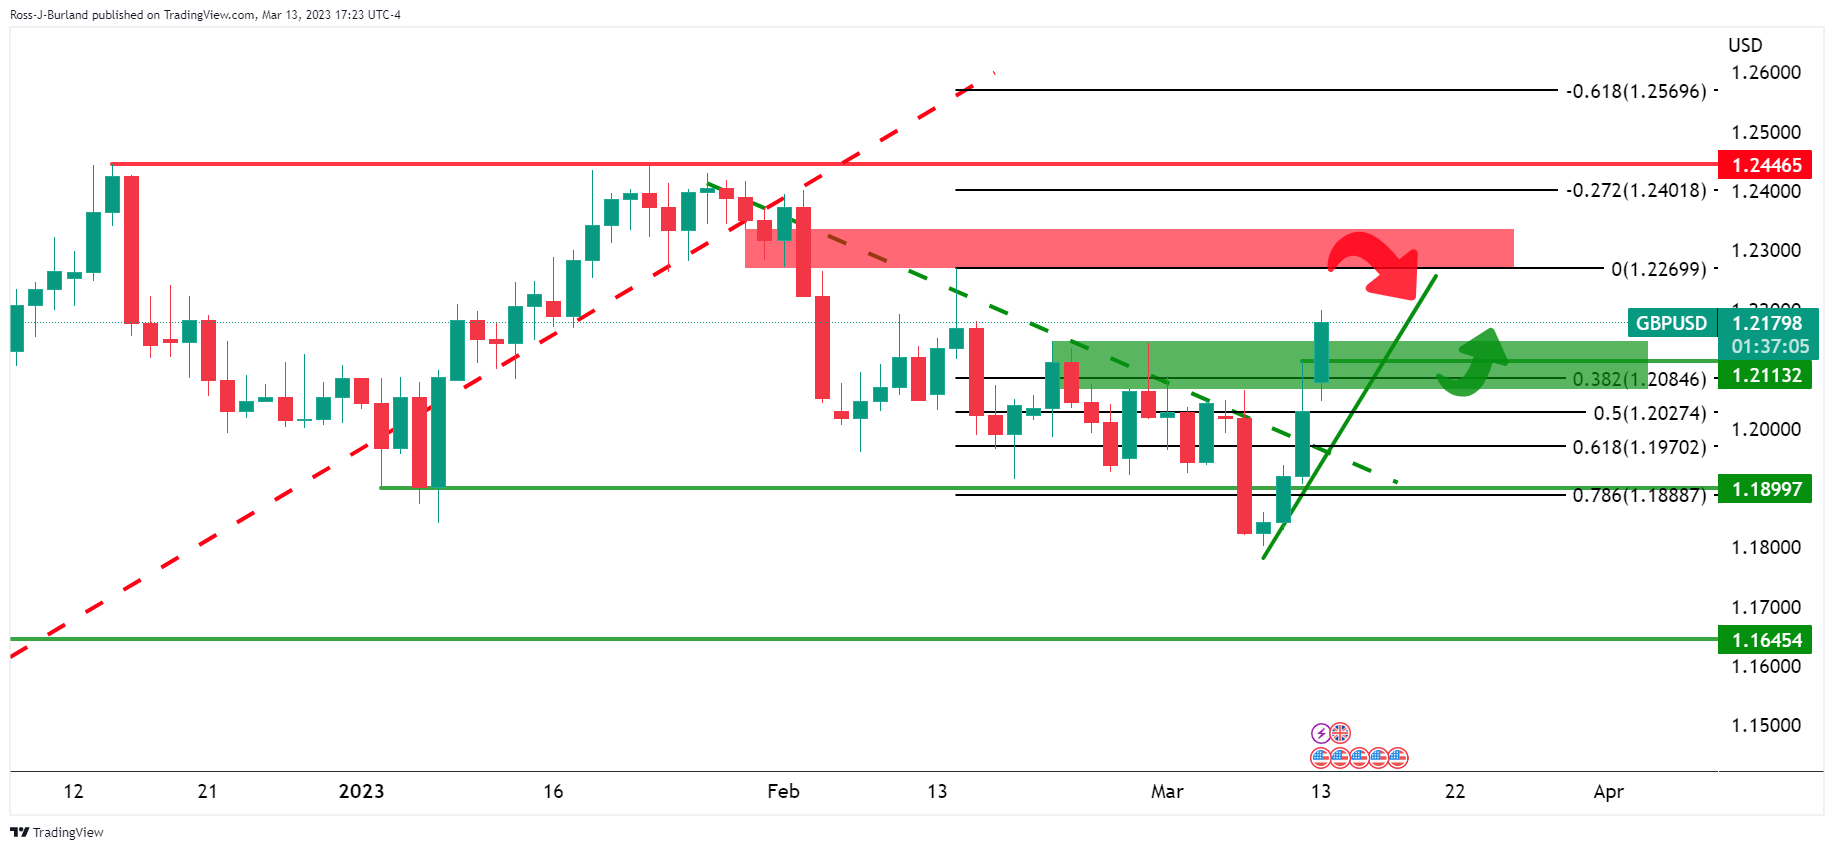
GBP/USD has run up towards an area of potential resistance area on the daily chart as the following will illustrate. This gives rise to the prospects of a significant correction over the coming week:

Drawing the Fibonacci from a presumed level where there could be resistance if the price were to continue higher over the next day or so, a 38.2% Fibonacci retracement level comes in near the 1.2080s as potential support.

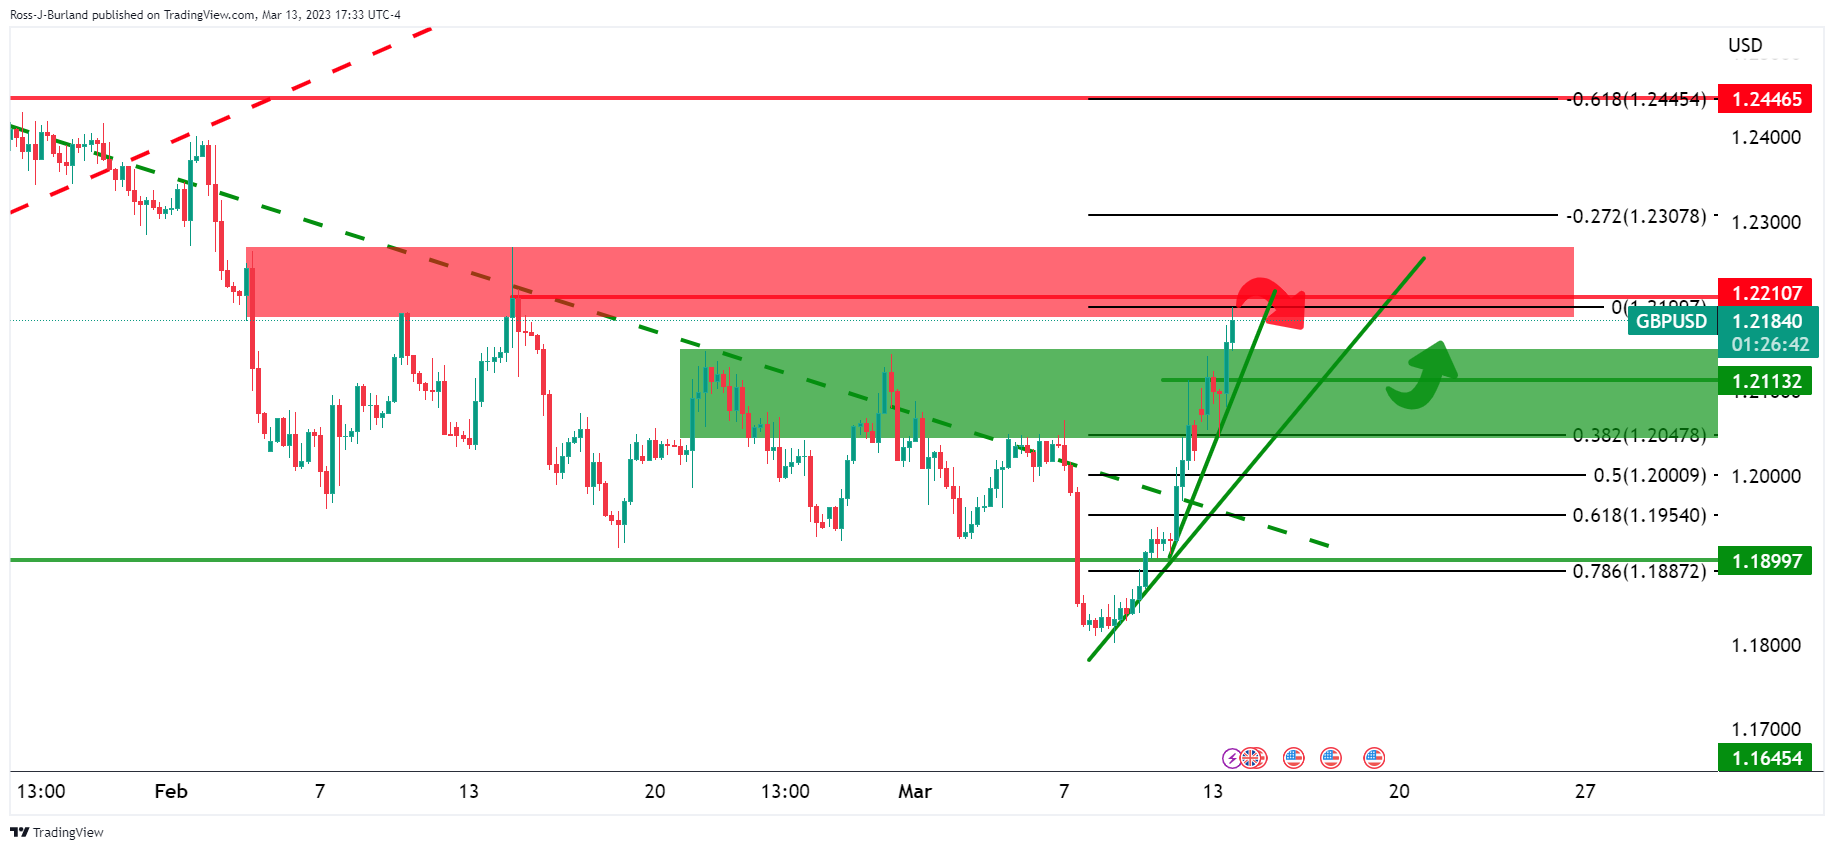
At this point, however, drawing the Fib from current highs, the 38.2% comes in at 1.2050.
GBP/USD H4 chart

Drilling down to the 4-hour chart, above, there could be a pop to test 1.2200-1.2250 but a subsequent failure and break of the micro-dynamic support will possibly lay the foundations for the anticipated correction.
GBP/USD H1 chart

Meanwhile, the price is still very much on the front side of the trend. However, the hourly micro trendline is now under some pressure adding substance to the corrective bias at this point. A break of the 1.2140 structure is needed to cement the bearish case for the day ahead.
