EUR/JPY Price Analysis: Focus on four-month-old rising trendline
- EUR/JPY stays on the back foot near the lowest level in 11 weeks.
- Sustained trading below 100-day SMA drags it to the key support line.
- The short-term falling trend line adds to the resistance.
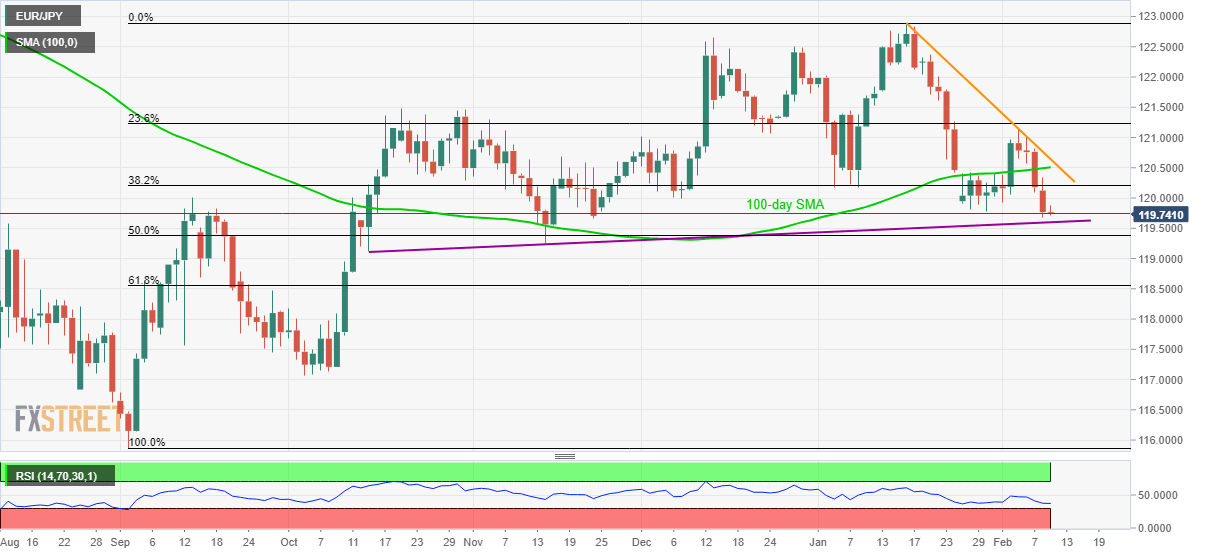
EUR/JPY declines to 119.73 during the Asian session on Tuesday. While the pair’s sustained trading below 100-day SMA portrays its weakness around the lowest since November 22, 2019, further downside will be challenged by the short-term key support line.
In addition to the four-month-old rising trend line, currently at 119.60, 50% Fibonacci retracement of the pair’s rise from September 2019 to January 2020, at 119.40, also questions the bears.
Additionally, mid-October 2019 low near 119.10, as well as 61.8% Fibonacci retracement near 118.55, could also please the bears during the past-119.40 declines.
Alternatively, an upside clearance of 100-day SMA, currently at 120.50, needs to cross a downward sloping trend line since January 16, around 120.65, to question the monthly top of 121.15.
EUR/JPY daily chart
Trend: Pullback expected